Detecting Shape Phenotypes
Víctor Manuel Tuset
2025-11-27
Source:vignettes/Phenotypes.Rmd
Phenotypes.RmdAbout this tutorial
The tutorial describes options for identifying otolith phenotypes and suggests evaluating stocks by assessing their phenotypic composition and variability (Tuset et al., 2019; Vasconcelos et al., 2021, 2025a,b; Jurado-Ruzafa et al., 2024). Use the wavelet at 4th scale and test several options.
1. Natural variability
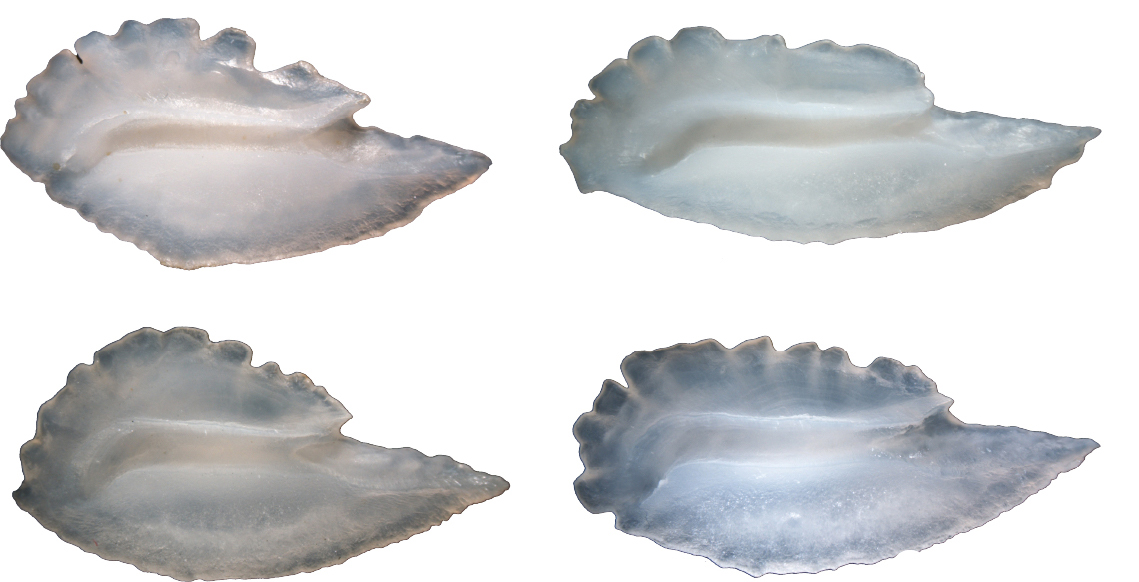
Populations contain specimens with different phenotypes. Stock differences can reflect the relative abundance of these phenotypes, which can vary seasonally; hence, monthly sampling is advised.
In pelagic fishes, such as Trachurus trachurus, elongated shapes seems to be linked to exhibiting high swimming activity.